Every React team hits the same moment. Someone wants a dashboard, the data is sitting in an API, and nobody wants to spend a week learning D3 to draw a line. That's the gap Recharts has filled for years, and in 2026 it's still filling it well. The project hasn't stood still: the 3.x generation brought stricter TypeScript typing, a big internal refactor, new hooks and documentation that now comes straight from the source code.
So is it still the default pick? For most dashboards, yes. For anything stranger, the answer gets more complicated. Icon Polls gives Recharts 3.5 out of 5, and the half point it loses on each side tells most of the story.
The scorecard
| Area | Score |
|---|---|
| React developer experience | 4.2/5 |
| TypeScript support | 4.2/5 |
| Chart type coverage | 4.1/5 |
| Documentation | 4.0/5 |
| Customization | 3.8/5 |
| Advanced interaction and animation | 3.1/5 |
| Performance on complex visuals | 3.0/5 |
| Overall | 3.5/5 |
Notice the shape. The top of the table is about how pleasant it is to get started. The bottom is about what happens when you push. That split is Recharts in a sentence.
Charts written like the rest of your app
Recharts is an open-source React library that uses D3 utilities under the hood and renders to SVG. You never really touch D3, though. You write JSX: a chart container, an X axis, a Y axis, a tooltip, a grid, a legend, and one or more data series. Each piece is a component, and each takes props.
That's the whole appeal. A chart sits in the component tree like a button or a form, and anyone who reads React can read it. Data flows in through props. Responsive layouts are handled by the library's responsive container. There's no separate configuration language to memorize, which is exactly what sets it apart from config-driven tools.
It's also free. Recharts ships on npm under the MIT license, so personal and commercial projects can use it without paying for anything. When we checked in August 2026, npm listed version 3.10.1 as the latest release.
What you can actually build
The catalog covers what a typical product dashboard asks for, and every type is assembled from the same building blocks, so the API stays consistent as you move between them.
- Line and area charts for trends over time, with area adding filled or cumulative emphasis
- Bar charts for category comparisons and grouped values
- Pie charts and treemaps for part-to-whole breakdowns, flat or hierarchical
- Radar and radial bar charts for multi-variable comparisons and circular progress
- Scatter charts for relationships between numeric variables
- Composed charts that mix bars, lines and areas in one view
- Funnel charts for stage-by-stage conversion
If your idea fits one of those, you're probably fine. If it doesn't, you'll feel it quickly.
The docs got better, with a ceiling
The documentation now lives on the Recharts GitHub Pages domain and is generated directly from source. That's a quiet but meaningful change: the API reference is far less likely to drift away from the version you've actually installed. Storybook examples and contributor guidance round it out.
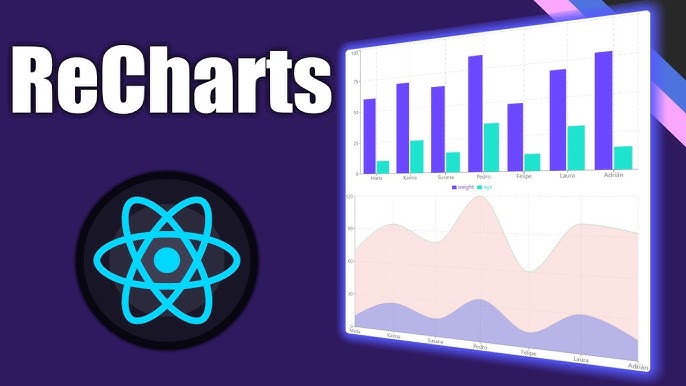
For common charts, you can copy an example and have something working fast. The weak spot is explanation for advanced cases. Once you're customizing interactions or working with the newer hooks, you may end up reading TypeScript definitions, source code or GitHub issues to understand how internal chart state behaves. The docs answer the everyday questions, not every question.
TypeScript, and the 3.x upgrade question
TypeScript declarations are built in, so there's no community types package to keep in sync. Version 3 tightened typing considerably and reworked state management and prop handling internally. That's good news for new projects, and a warning for old ones.
Starting fresh? Install the current 3.x release and move on. Running a mature app on 2.x? Read the breaking changes first, then test your custom labels, tooltips, renderers and animations before shipping. Those are precisely the places where an internal refactor tends to show up.
Where SVG starts to hurt
SVG gives you sharp charts that are easy to style. It also means every point, bar and label is a DOM element. With normal dashboard datasets, that's no problem at all. With thousands of complex elements, or dense real-time data, the browser starts to struggle, and a canvas-based library will usually serve you better.
The other ceiling is customization beyond styling. Custom shapes, synchronized charts, unusual interactions and heavy animation are all possible, but they ask you to understand Recharts internals and SVG behavior. Large charts with many custom parts also get verbose; the declarative style that feels clean at twenty lines feels crowded at two hundred. And teams hoping for built-in themes or dashboard-level features may find the box a little bare.
A note on "Recharts transcript"
People search for this, so to be clear: Recharts has no transcript feature. It doesn't transcribe audio or video. The phrase usually points to tutorial transcripts or copied code. That said, if another system has already turned transcripts into numbers, Recharts can chart them happily: speaking time as a line, speaker frequency as bars, topic share as a pie.
If Recharts isn't the right fit
The alternatives split by what you need more of:
- Apache ECharts for feature-rich dashboards with a bigger catalog and richer built-in interaction
- Chart.js (via React wrappers) for teams who prefer a configuration-driven API and a huge general ecosystem
- Nivo for React-first charts with attractive defaults
- Victory for composable React charts and cross-platform work
- Visx for lower-level control without leaving React
- D3 when the chart is the product and you need total control
Who should pick it
Choose Recharts when you're building a clean React dashboard or analytics page with familiar chart types, and you want the chart code to read like the rest of your app. It's actively maintained, typed, free and widely used, which means examples are everywhere.
Look elsewhere, or at least compare before committing, when the visualization itself is the feature: huge datasets, live streams, bespoke interactions or animation that has to feel special. ECharts, Visx or D3 will cost more effort up front and save you a fight later.
For more tech and pop culture takes, browse the latest from our writers on the Icon Polls blog.
Quick answers
Is Recharts better than Chart.js?
Inside React, Recharts usually feels more natural because charts are composed from components. Chart.js may suit teams that prefer configuration objects and want its broad ecosystem.
Can Recharts handle large datasets?
It handles normal dashboard data well. Very large or fast-changing datasets can strain SVG rendering, where canvas-based libraries tend to perform better.
Should I upgrade from Recharts 2.x?
Probably, but carefully. Version 3 changed a lot internally, so review the breaking changes and test any custom labels, tooltips and animations first.