Most analytics tools fail the same way. The data is in there somewhere, but getting a straight answer means building a report, adding a filter, adding another filter, and hoping you picked the right metric. Usermaven is built around a different bet: that most marketers and product managers would rather ask a question than assemble a dashboard. In 2026 that bet looks smarter than ever, because its built-in assistant, Maven AI, is now the centre of the product rather than a side feature.
Icon Polls rates Usermaven 4.3 out of 5. It is one of the cleaner ways for a SaaS company, agency or marketing team to see traffic, funnels, journeys and revenue attribution in one place. It is also not cheap, and there is no free tier to fall back on. Both things matter.
How we scored it
These are Icon Polls editorial scores, based on Usermaven's published features, plans and documentation.
| Area | Score |
|---|---|
| Website and product analytics | 4.6/5 |
| Maven AI | 4.5/5 |
| Attribution and customer journeys | 4.5/5 |
| Reporting and dashboards | 4.5/5 |
| Ease of use | 4.4/5 |
| Login and setup | 4.3/5 |
| Pricing value | 3.9/5 |
| Overall | 4.3/5 |
One workspace, two very different users
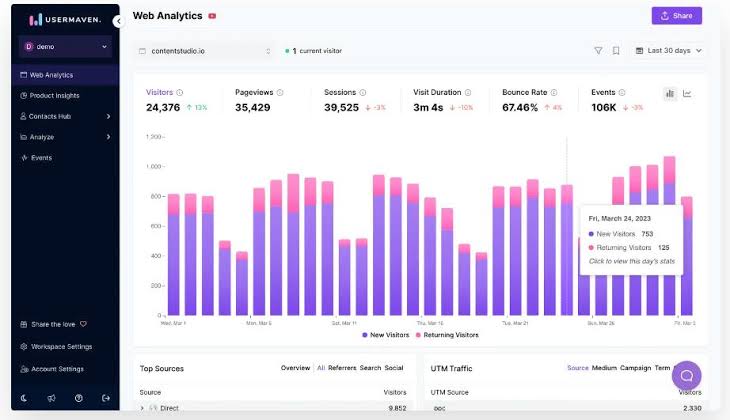
Usermaven combines website analytics, product analytics, funnels, user journeys, segments, dashboards, attribution and contact-level data. That sounds like a feature list, but the practical point is who sits at the screen. A marketer can check which channels actually drive revenue. A product manager can look at activation, retention and feature adoption. Normally those people live in separate tools and argue over whose numbers are right. Here they share one source.
Funnels show where people drop out. Journeys trace the routes users take across sessions, devices and channels. Segments let you compare groups, and contact and account profiles go down to the individual user or business account. There is also automatic exclusion of bot and proxy traffic, plus a measurement trust center. That sounds dull. It isn't. Analytics polluted by automated visits quietly ruins every decision built on top of it.
Asking Maven a question
Maven AI is the reason to look at Usermaven now. You type a question in plain English: which channel drove the most signups, why conversions fell, how a campaign shifted over a given period. It answers from the data in your workspace.
It can also build things. Describe the dashboard you want and Maven creates the reports, adds relevant tiles, and can fold in attribution or retention analysis. For someone who knows the business question but not the name of the report that answers it, that is a real time saver.
The honest caveat: AI can't fix bad tracking. If events are missing, names are inconsistent or attribution data has gaps, Maven will answer confidently from a flawed base. Treat it as a faster way to interrogate reliable data, not a substitute for setting tracking up properly.

What the plans cost
Pricing depends on the plan and your monthly event volume, starting at 250,000 events a month. More events means a higher bill.
| Plan | Starting price (2026) | Built for |
|---|---|---|
| Growth | $84 per month | Website, product and ecommerce analytics |
| Scale | $199 per month | Attribution, paid ads, CRM revenue, advanced reporting |
| White Label | From $49 per month | Agencies and client-facing analytics |
| Guided Setup | $499 one-time | Teams wanting help planning and validating tracking |
Growth gives you three users, three workspaces and five years of data history. It covers traffic, product usage, ecommerce, funnels, journeys, profiles, segments, Search Console reporting, and email and Slack reports.
Scale adds unlimited users, five workspaces and seven years of history, along with paid-ad attribution, channel revenue attribution, content attribution, CRM revenue, multi-touch conversion paths and ad-platform tracking. If you need to know which touchpoints influenced a sale rather than just the final click, this is the plan you are really shopping for.
Annual billing saves 15 percent, and there is a 14-day free trial with no credit card required.
Getting in and getting set up
Login is painless: Google, a passkey, or a work email and password, with password recovery and a Remember Me option. Passkey support is a welcome touch for anyone who wants stronger security without typing a password every time. If your team works across several workspaces, check which property you are in before changing tracking settings, and give each person their own login rather than sharing one.
Setup follows a sensible path. Create an account, add a workspace, install the tracking script or integration, then confirm events are arriving. From there, open the website overview, build a funnel, inspect a few journeys and assemble a dashboard around the metrics that actually matter. The help center covers integrations, API connections, ecommerce tracking and attribution in detail.
The $499 guided setup is worth considering for teams with no tracking plan. Usermaven reviews your business model and customer journey, writes a tracking plan, guides implementation, validates events and helps configure dashboards. Note the limit: it guides, but it does not write or deploy your code.
A browser tool, and that's fine
Usermaven is a web application, not a downloadable desktop or mobile app. For analytics work that is mostly sensible. Comparing funnels and journeys side by side wants a big screen. Email and Slack reports fill the gap, so routine numbers come to you and you open the platform only when something needs investigating.
Why the price stings for small sites
Here is the main weakness. A modest blog or side project will find $84 a month hard to justify next to free or cheaper alternatives, and there is no permanent free plan. Event-based pricing also means costs climb as you grow. The most valuable attribution features sit behind the $199 tier.
For a SaaS business or agency that would otherwise pay for several analytics products, the maths changes quickly. Consolidation is the selling point.
Strengths and weak spots
- Strong: website, product and ecommerce analytics in one place
- Strong: Maven AI answers questions and builds dashboards from a conversation
- Strong: solid funnel, journey, segment and retention tools
- Strong: bot and proxy filtering keeps reports cleaner
- Weak: high starting price and no free plan
- Weak: deeper attribution locked to Scale
- Weak: AI insights are only as good as your event tracking
Our call
Usermaven makes serious analytics feel less intimidating without stripping out the tools a growing business needs. That earns its 4.3. Price is what holds it back from a higher score.
Use the trial properly. Connect real production data, build one funnel, follow a customer journey, ask Maven a handful of real business questions and compare the answers with your current reporting. If it saves your team genuine hours, the subscription pays for itself. If you are still deciding what to track, sort that out first. For more tools and rankings, browse the latest reviews and fan polls on Icon Polls.
Does Usermaven have a free plan?
No permanent free plan. There is a 14-day free trial that does not require a credit card.
Can it replace Google Analytics?
For many businesses it can cover website analytics while adding product analytics, funnels, journeys and attribution. Whether it fully replaces another tool depends on your reporting and integration needs.
Is it suitable for agencies?
Yes. The White Label option, from $49 a month, offers custom branding, domains, email reports and multi-workspace support for client-facing work.